
Land Use Change Verification Platform
Satellite-powered compliance for global supply chains
Conducting automatic analysis at the land-field-plot level to ensure compliance with EUDR, EPA and 2BSvs standards
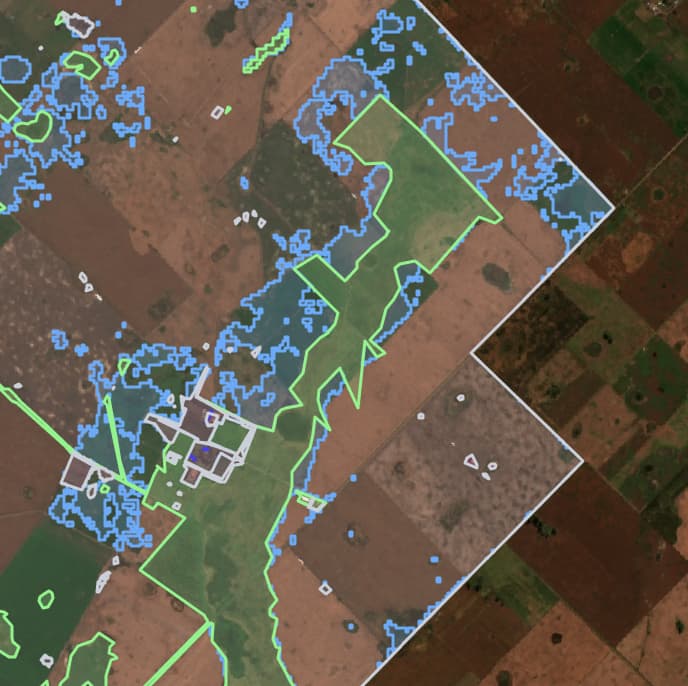
Six Verification Layers
Understand key factors such as deforestation previous and post 2020, legal land use change, grasslands, croplands and more for every farmer your company collaborates with.
Our platform helps auditors review standard specific layers on top of maps from different years and export specific reports for each productive farm.

Deforestation
We analyze the impact of deforestation at field, farm and departmental level with variable cutoff dates depending on the standard.
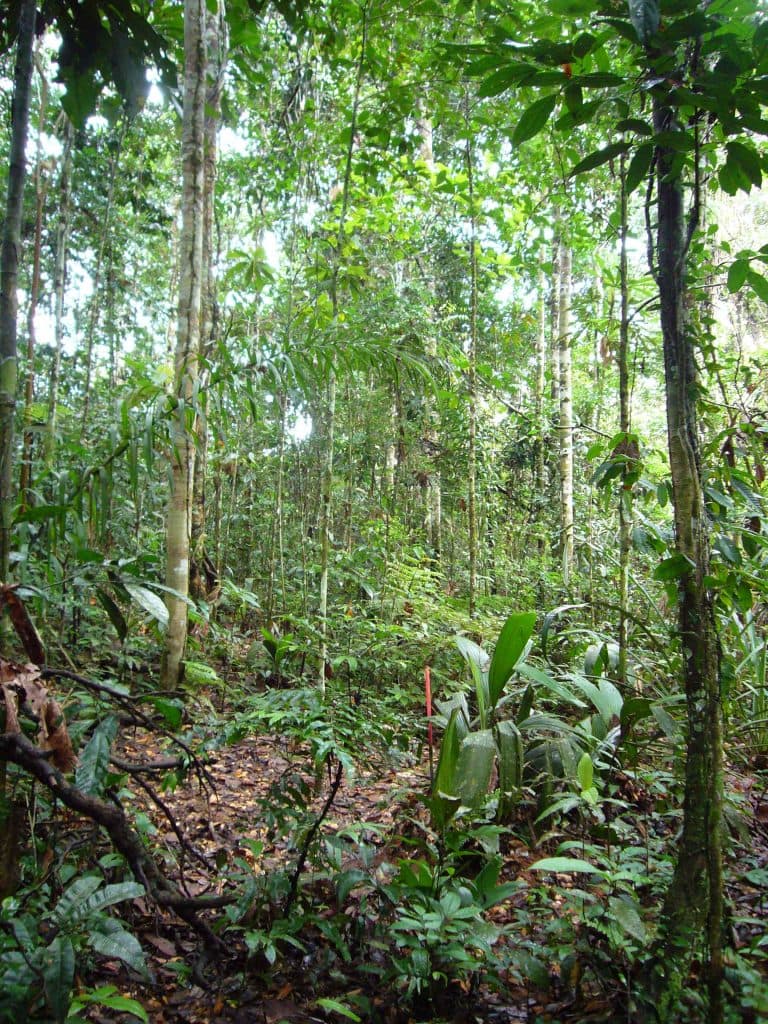
Native Forest
We analyze whether production takes place outside the influence of high conservation value of native forests

Wetland Protection
We analyze the production proximity to conservation areas, and rational use of wetlands and their resources

High Biodiversity
We analyze whether production areas are located within defined protected areas or species conservation areas
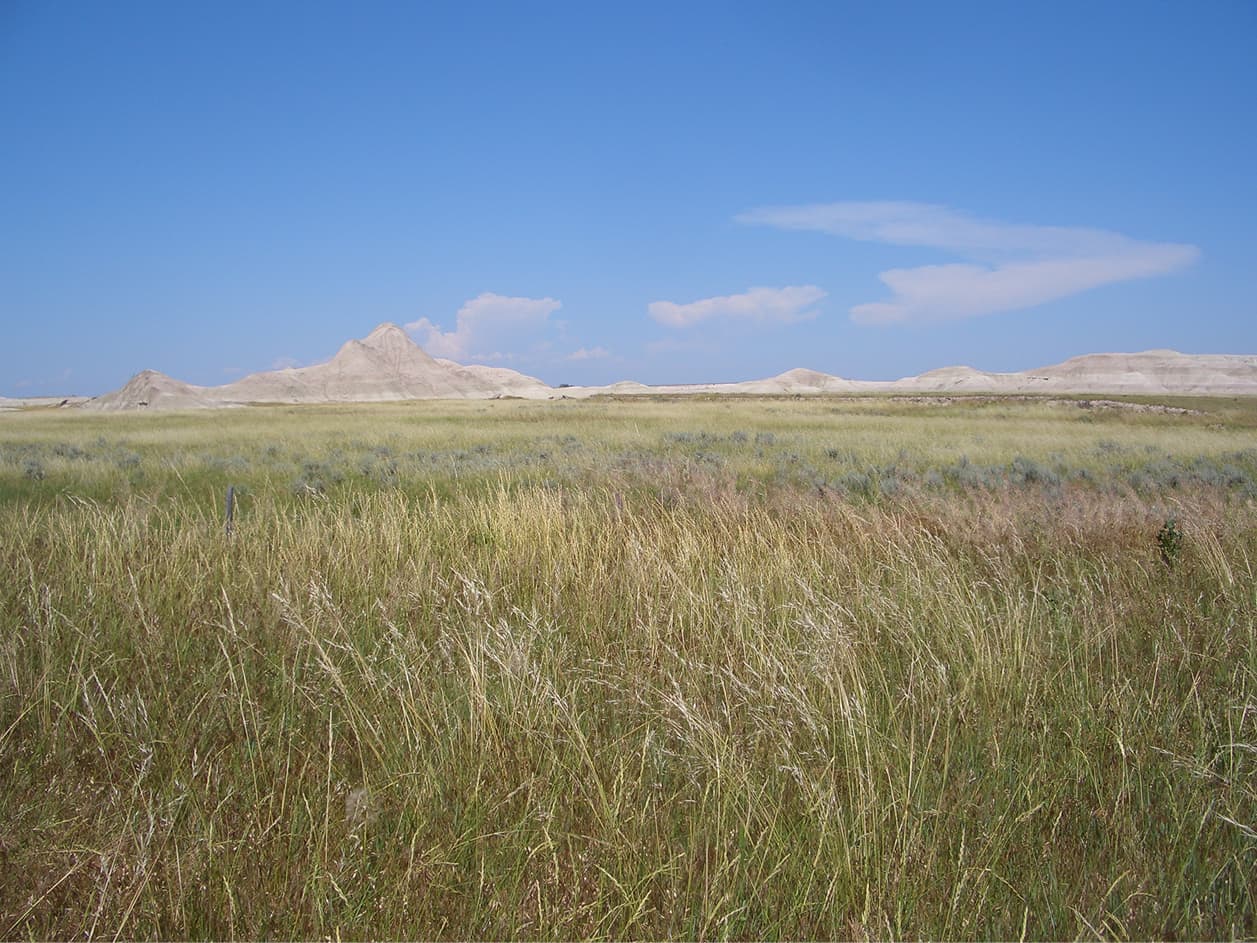
Grassland
We analyze that no high-value grassland for carbon capture is intervened for production
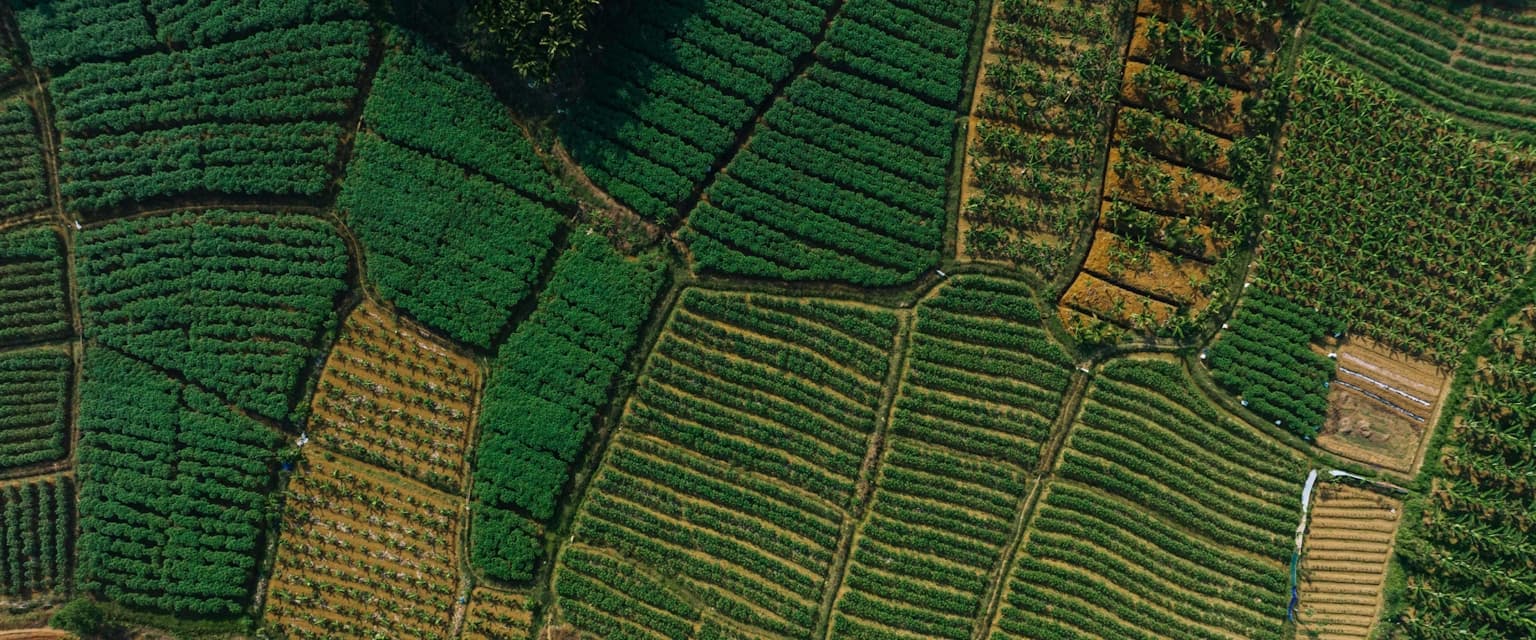
Crop Land
We analyze whether production areas have changed their use
Proprietary Detection Algorithms
To reliably detect deforestation, reforestation, field boundaries and crop types in multiple geographies and standards, we complement traditional public layer analysis with our own machine learning algorithms trained with thousands of hours of labeling.
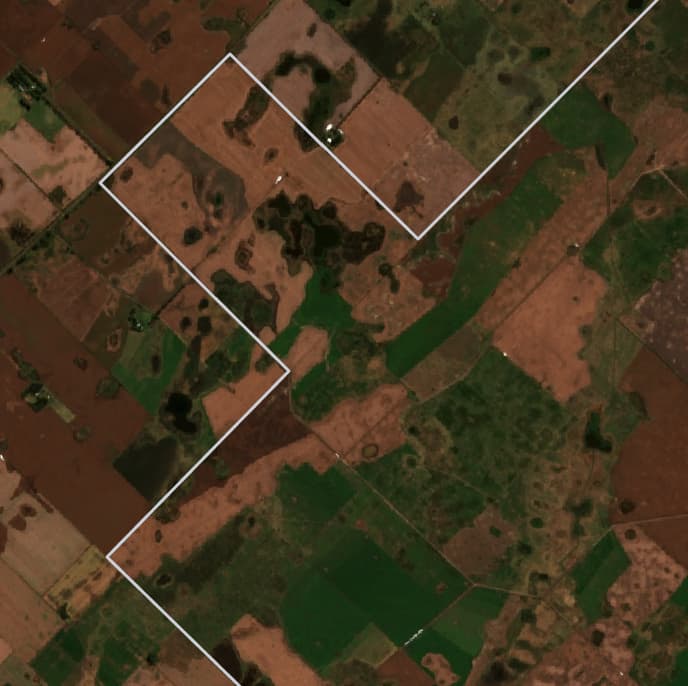
Raw Satellite Imagery
Standard earth observation data
ML-Processed Results
Field boundaries, deforestation & crop types detected
Crop Type Classification
Recognize soy, corn, cotton, sunflower, peanut — even before harvest — to scale your sustainable origination
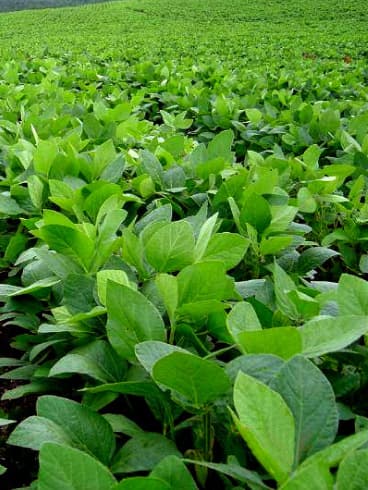
Soy
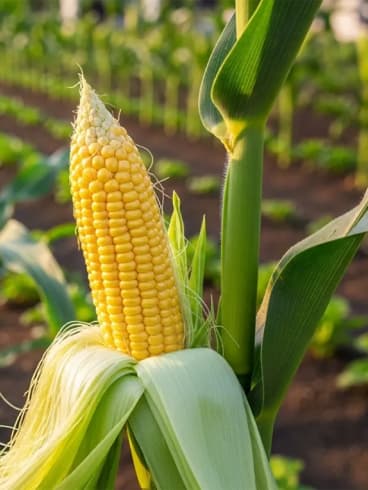
Corn

Cotton

Sunflower
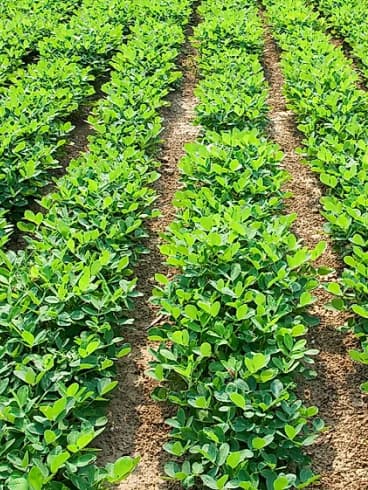
Peanut
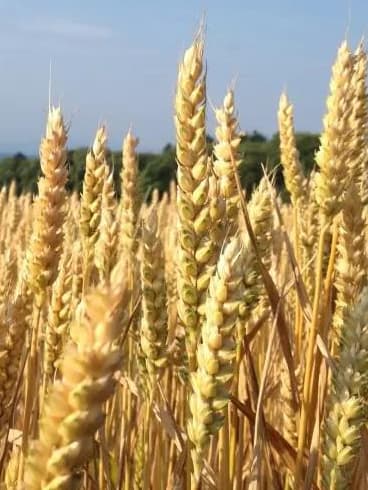
Wheat
Soy
Corn
Cotton
Sunflower
Peanut
Wheat
Evidence & Data Capture, at Scale
Beyond satellite verification, ucrop.it enables your team to collect, validate, and audit structured evidence directly from producers — all managed from the same geospatial platform.
Sworn Crop Declarations
Legally binding producer statements on cultivated crop types, surface area, and harvest dates — structured and digitally signed.
Carbon Footprint Calculations
Automated carbon calculations per field and crop cycle, including emissions from inputs, machinery, and land use change.
Input Documentation
Full traceability of pesticides, fertilizers, and other inputs applied — linked to field, lot, and operator.
Custom Surveys & Questionnaires
Deploy configurable forms to producers for any standard, certification, or buyer-specific data requirement.
Geospatial Field Evidence
Photo and GPS-stamped evidence tied to specific plot coordinates, timestamps, and producer identities.
Audit-Ready Records
Every submission is timestamped, version-controlled, and exportable — ready for third-party auditors and certification bodies.
Built to Adapt to Your Market
Every supply chain operates within a unique regulatory, ecological, and geographic context. ucrop.it is designed for enterprise teams that need the platform configured to their exact operational reality — not a generic off-the-shelf tool.
- Region-specific geospatial layers — local protected areas, indigenous territories, and jurisdiction-defined boundaries
- Climate and seasonal calibration for crop phenology, drought indices, and precipitation patterns
- Custom compliance rulesets per origin country, standard, or buyer specification
- White-label reporting templates aligned to your audit workflows and branding
Fully Configurable
Per region, standard & buyer
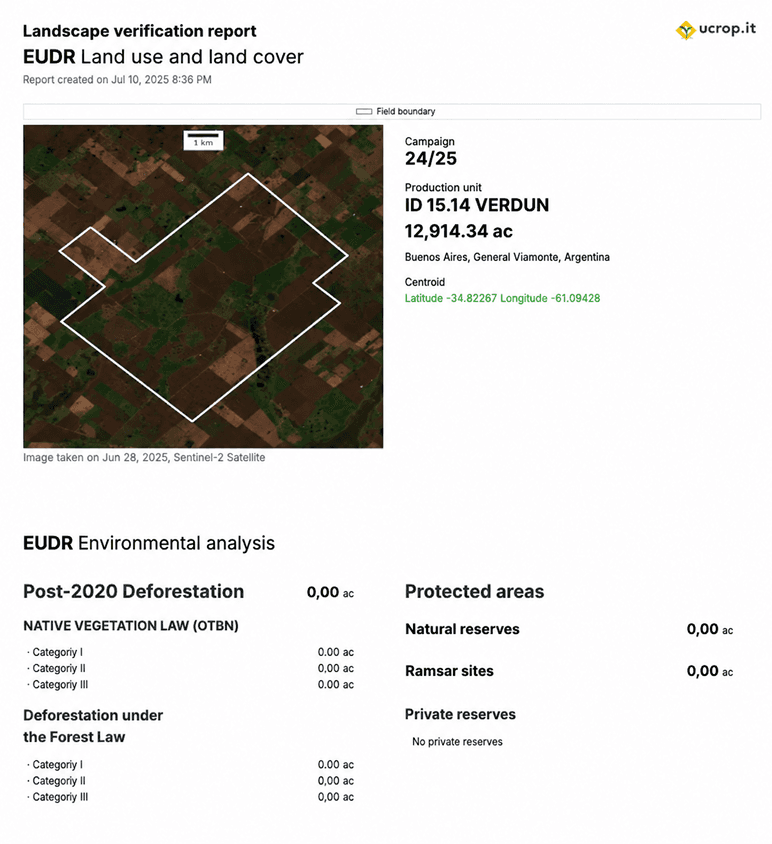
Comprehensive Reports
Every standard and certification comes with different criteria. Some standards analyze every field on the farm, while others assess the entire farm. Certain standards also require sworn declarations of the crop type in every field. At ucrop.it, we create a new template and configuration for each specification, which, once agreed upon, can be used at scale.
🏆 Officially Certified
We have been granted official platform status for 2BSvs, and our technology has been approved for use with EPA and other standards.
Audit-Ready Format
PDF + Data exports
2BSvs
Standard-specific reporting
EUDR
Standard-specific reporting
ISCC
Standard-specific reporting
EPA
Standard-specific reporting
Request a Platform Demo
Discuss how we can integrate with your actual process to scale your sustainable sales